01
Research overview
02 Context
The problem with AI visibility scores
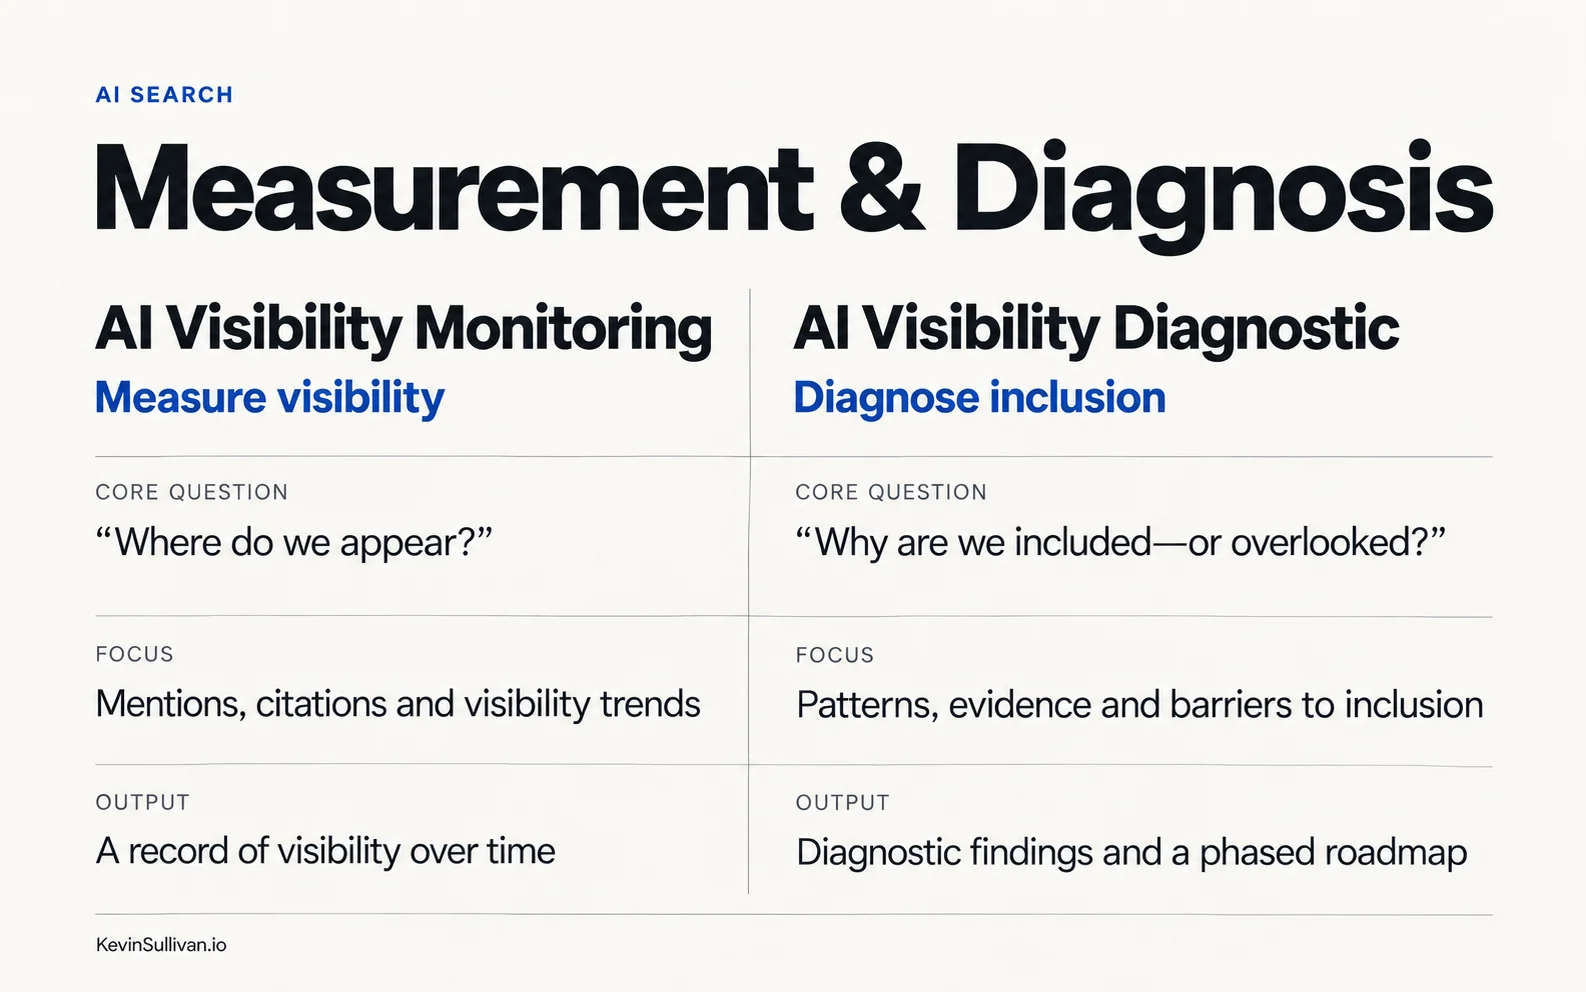
Visibility monitoring is useful. It can show whether a brand appeared, how frequently it appeared and which competitors were included. A visibility score does not necessarily explain why those results occurred.
A company may be absent because its business category is unclear. Its products may not be connected to the applications they serve. Its locations may be visible while its national operating model remains difficult to interpret. It may also have strong first-party claims without enough external evidence to support them.
The diagnostic was designed to move from measurement to explanation:
| Monitoring can show | The diagnostic investigates |
|---|---|
| A brand was absent | Why the brand may have been excluded |
| A competitor appeared | What evidence or structure supported its inclusion |
| A page was cited | What role that page played in the answer |
| Visibility changed | Which underlying signals may have changed |
| A visibility score | What a team should address first |
The goal is not to assign a score and stop. The goal is to understand how the business is represented, where interpretation breaks and which changes can be implemented and tested.
03 Method
Three lenses for diagnosing AI visibility
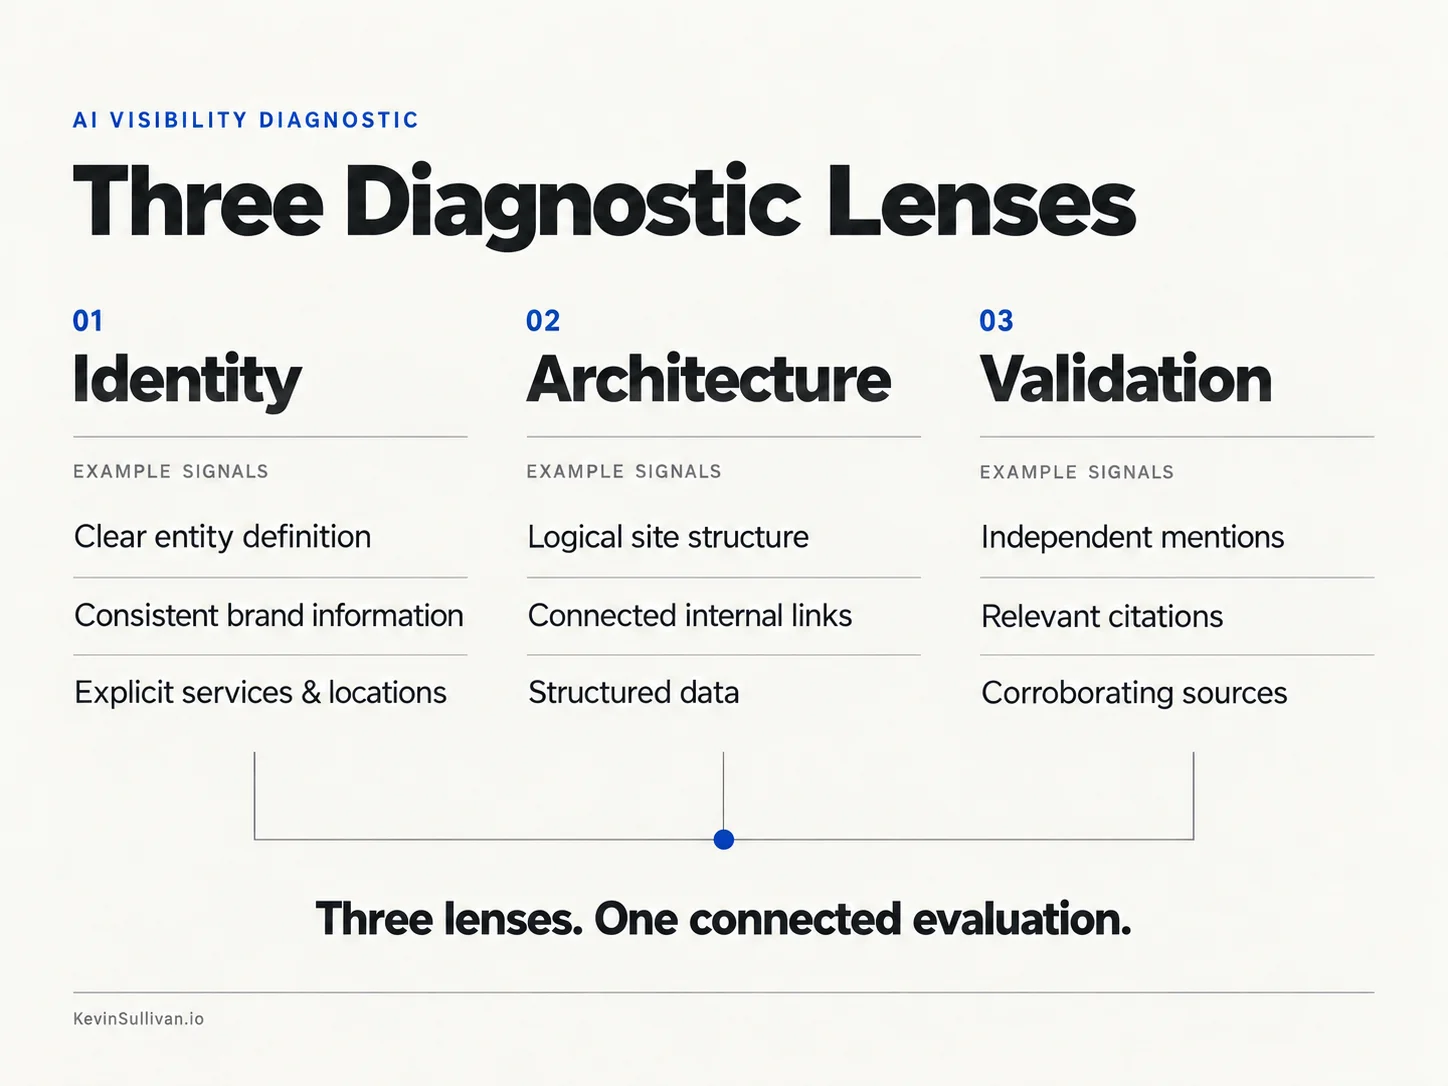
The methodology evaluates a company through three connected lenses.
1 · Identity
Does the system understand what the company is?
- Business category
- Market position
- Products and services
- Locations and service areas
- Manufacturer, distributor, dealer and installer roles
- Naming consistency
- Ownership and partner relationships
If these signals conflict, the company may be recognized without being classified correctly.
2 · Architecture
Can the system understand how the business is organized?
- Product and service pages
- Application and use-case pages
- Location architecture
- Product-to-application relationships
- Product-to-feature relationships
- Internal linking
- Structured data
- Buying and fulfillment pathways
A company can have extensive content without providing a clear information model.
3 · Validation
Can the system corroborate the company’s claims?
- Reviews
- Directories and citations
- Certifications
- Technical documentation
- Partner and dealer references
- Industry mentions
- Product specifications
- External corroboration
First-party claims explain what a company wants to be known for. Validation helps establish whether those claims can be supported.
04 Context
Field application: Realturf USA
Realturf USA presented a useful diagnostic environment because it could not be represented as one simple local business. The company operated within a larger system involving:
- A global manufacturer
- A U.S. distribution organization
- Realturf Centers
- Authorized dealers
- Installer relationships
- Products and product variants
- Branded technologies
- Applications and use cases
- Local pickup and national fulfillment
Google could recognize many of these individual elements. The central question was whether it could connect them into a reliable model of what Realturf USA was, what it supplied, who it served and how customers could buy from it.
Research conditions
All original tests were conducted manually in Google Chrome Incognito Mode. The research focused exclusively on Google AI Overviews. It did not include ChatGPT, Claude, Gemini or Perplexity.
Incognito Mode reduced the effect of account history and some forms of personalization. It did not eliminate variables such as location, language, device context, Google experiments or changes to AI Overviews over time.
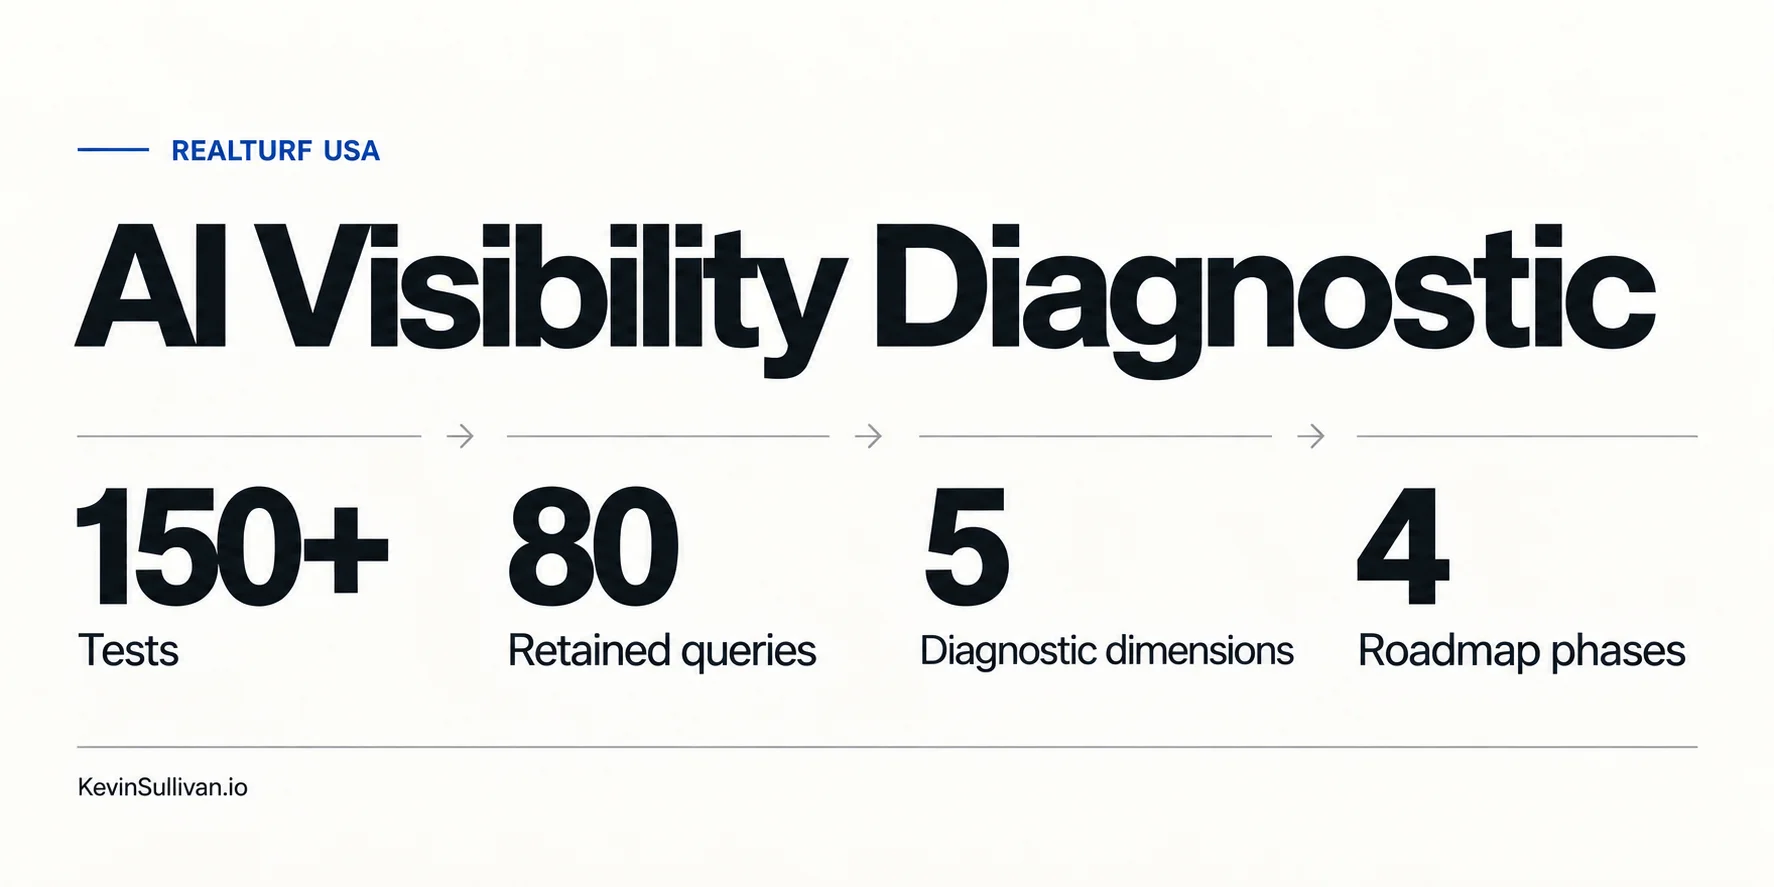
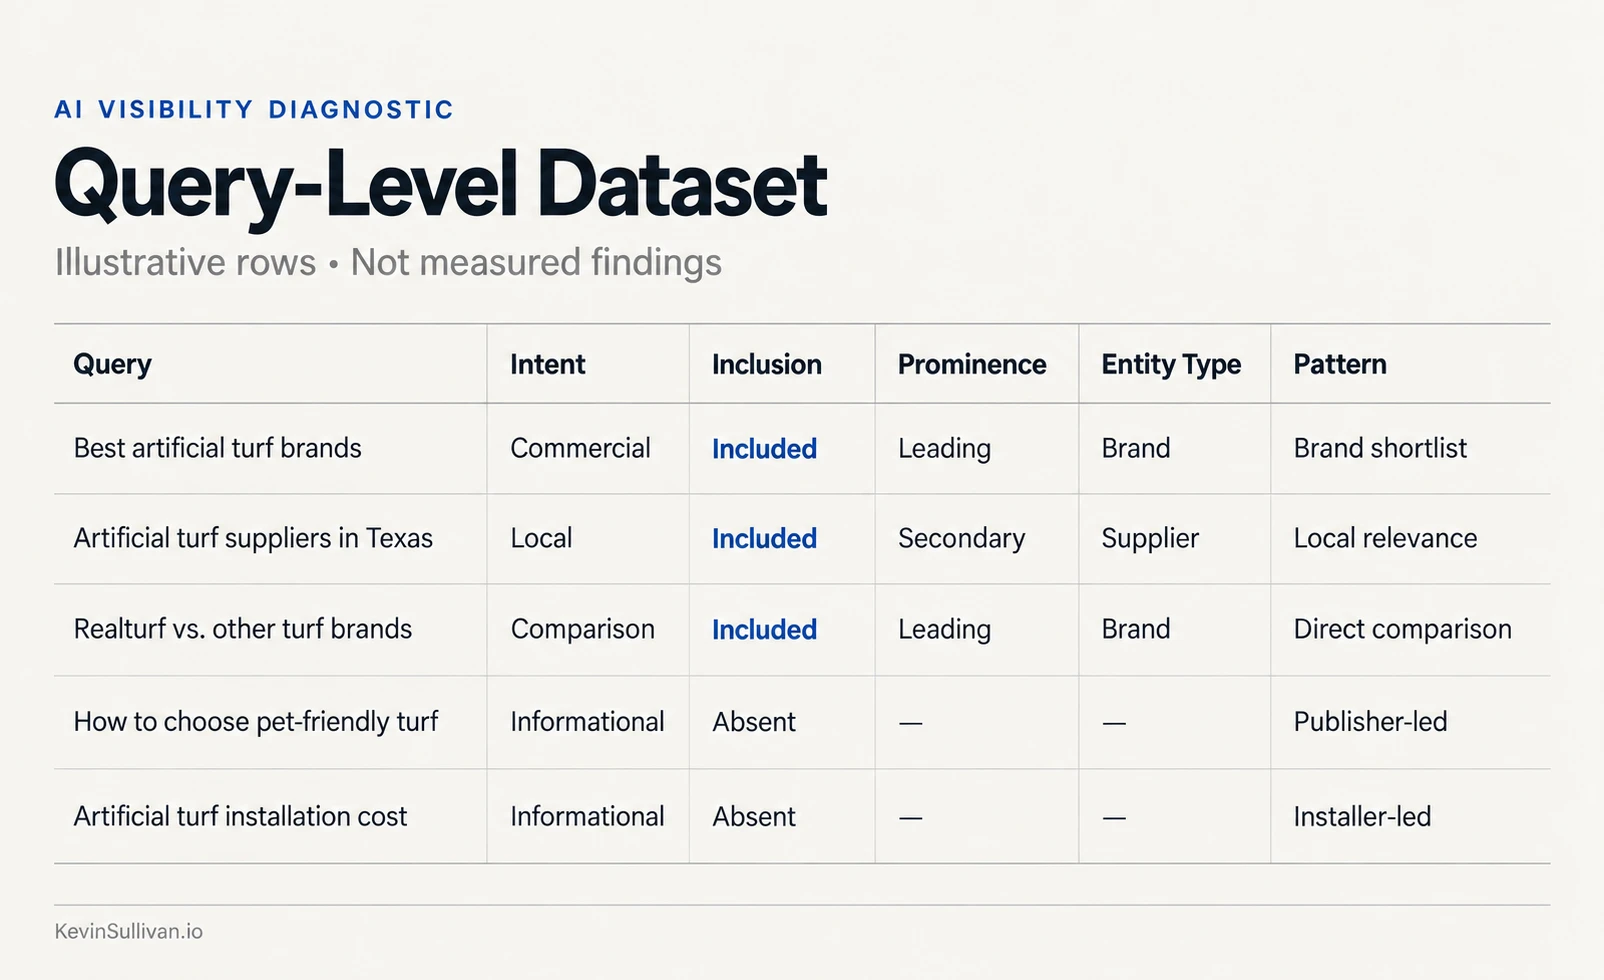
More than 150 searches were conducted. Eighty representative queries were retained in the final diagnostic dataset so the evidence would remain manageable while covering the major intent categories:
- Supplier and distributor
- Product
- Feature
- Application
- Comparison
- Local and location-based
- Commercial procurement
- Educational
05 Method
Building a structured evidence system
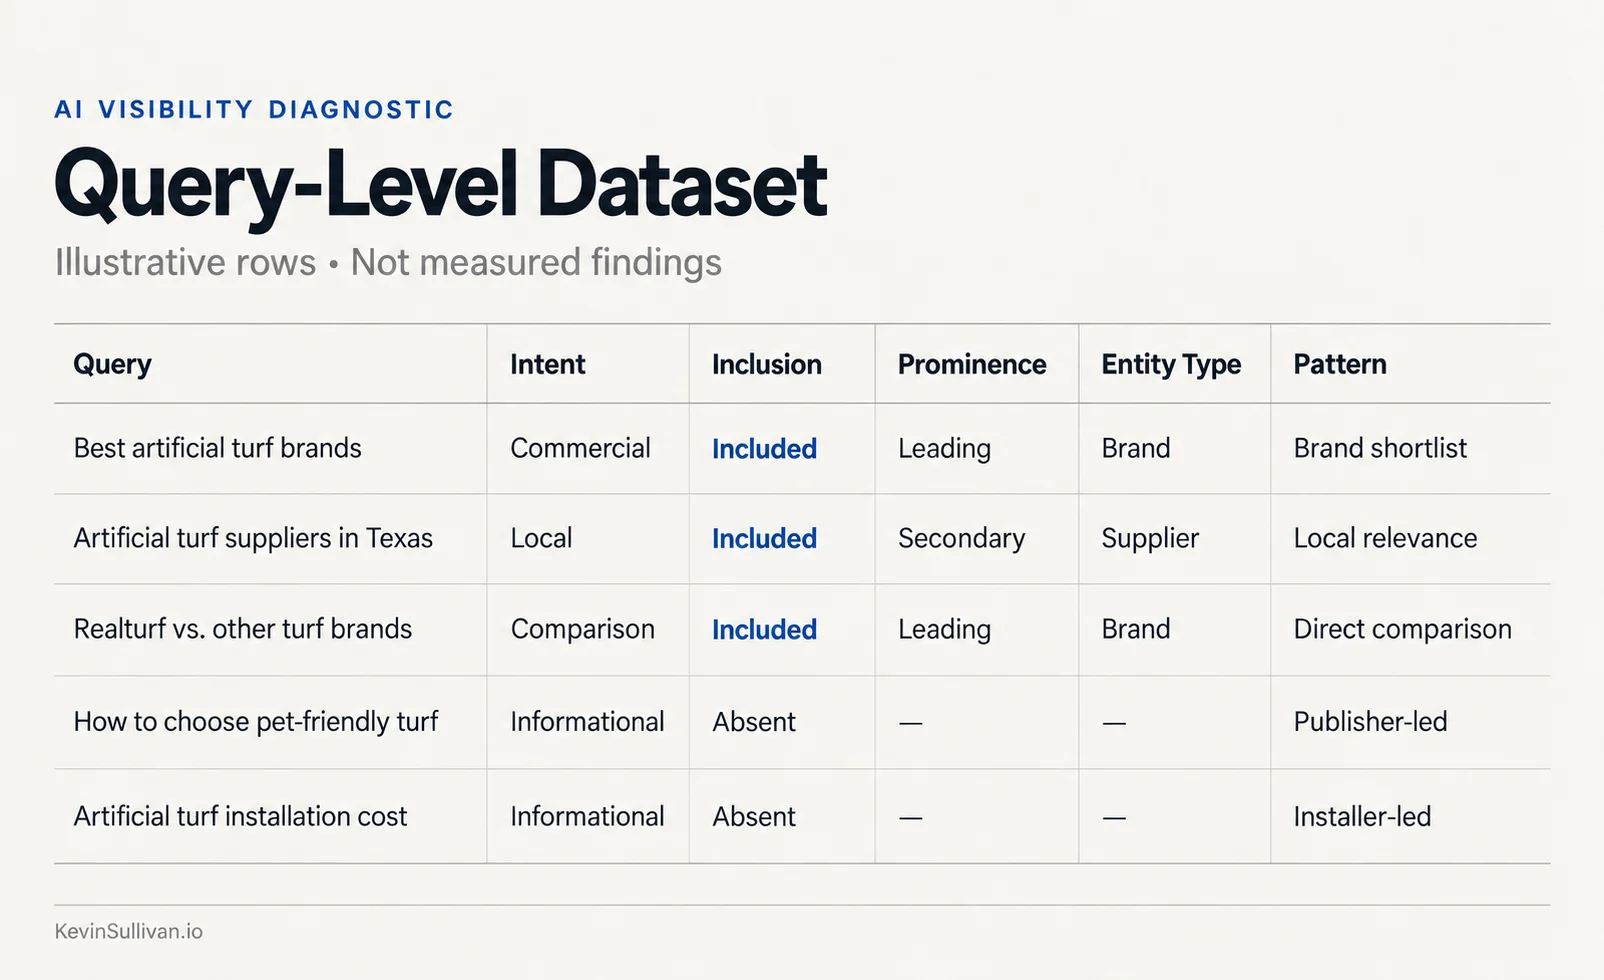
Each retained query was classified using a defined set of fields:
- Query
- Query type
- Intent strength
- AI Overview presence
- Realturf inclusion
- Result prominence
- Entity type observed
- Business type
- Signal strength
- Competitors present
- Pattern observed
- Supporting notes
- Screenshot evidence
Inclusion was classified as primary, secondary, indirect or absent. Prominence was evaluated separately. A company could appear in an answer without being emphasized or visible in the initial result.
The dataset also distinguished between high-intent sourcing queries, comparison queries and lower-intent informational queries. This made it possible to identify patterns across groups of searches instead of treating every result as an isolated observation.
06 Method · custom score
Five scored dimensions
I translated the research into a custom diagnostic scorecard. The score was intended to support prioritization. It was not presented as an industry-standard AI visibility metric.
| Dimension | Relative score | Score |
|---|---|---|
| VisibilityInclusion across the retained query set | 18/30 | |
| Entity clarityConsistency of Realturf’s interpreted business role | 13/15 | |
| ArchitectureProduct, application, location and system structure | 10/20 | |
| RelationshipsConnections among products, applications, locations and partners | 5/15 | |
| ValidationExternal evidence and corroborating signals | 10/20 | |
| TotalWeak, approaching emerging | 56/100 | |
How visibility was calculated
Each inclusion level received a value, and queries were then weighted by intent. The result was normalized to a maximum visibility score of 30.
| Inclusion level | Value |
|---|---|
| Primary | 1.0 |
| Secondary | 0.7 |
| Indirect | 0.3 |
| Absent | 0 |
| Intent level | Weight |
|---|---|
| High intent | 1.5× |
| Medium intent | 1.0× |
| Low intent | 0.5× |
The other dimensions used defined criteria for entity interpretation, site structure, relationships and validation.
The diagnostic received a high internal confidence rating because the analysis included more than 15 queries, showed recurring patterns across query types and had supporting website, search and external evidence.
07 Observed evidence
What the testing revealed
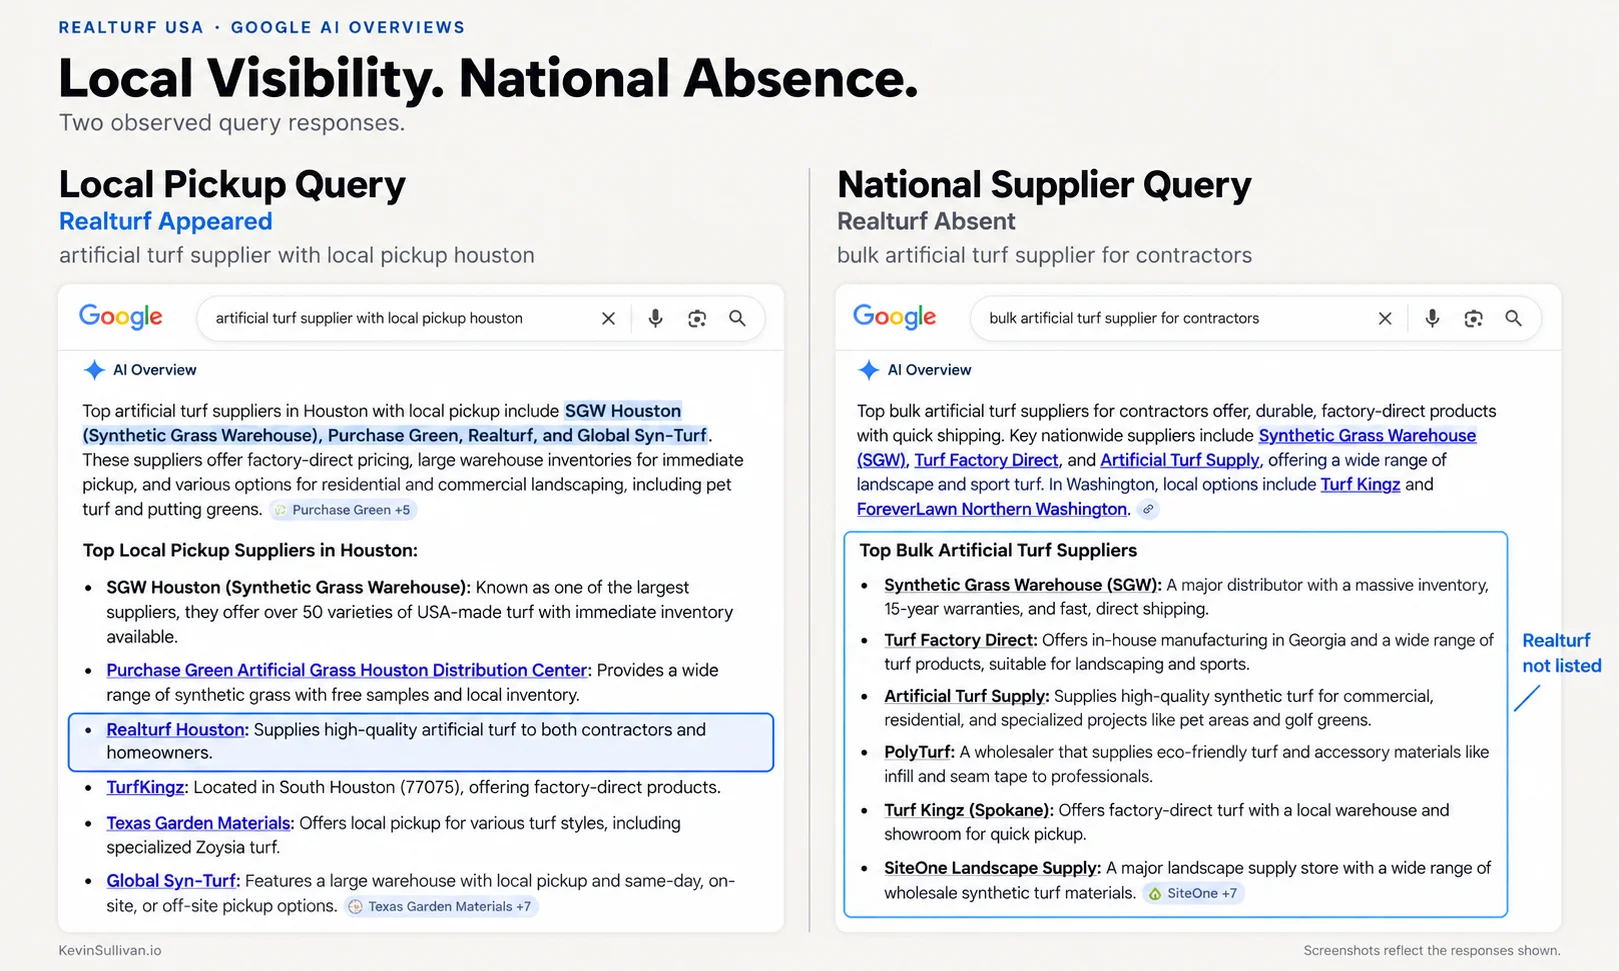
Realturf was not invisible. Google could recognize the company, extract product information and identify several physical locations. The problem was inconsistency.
Appeared most reliably with
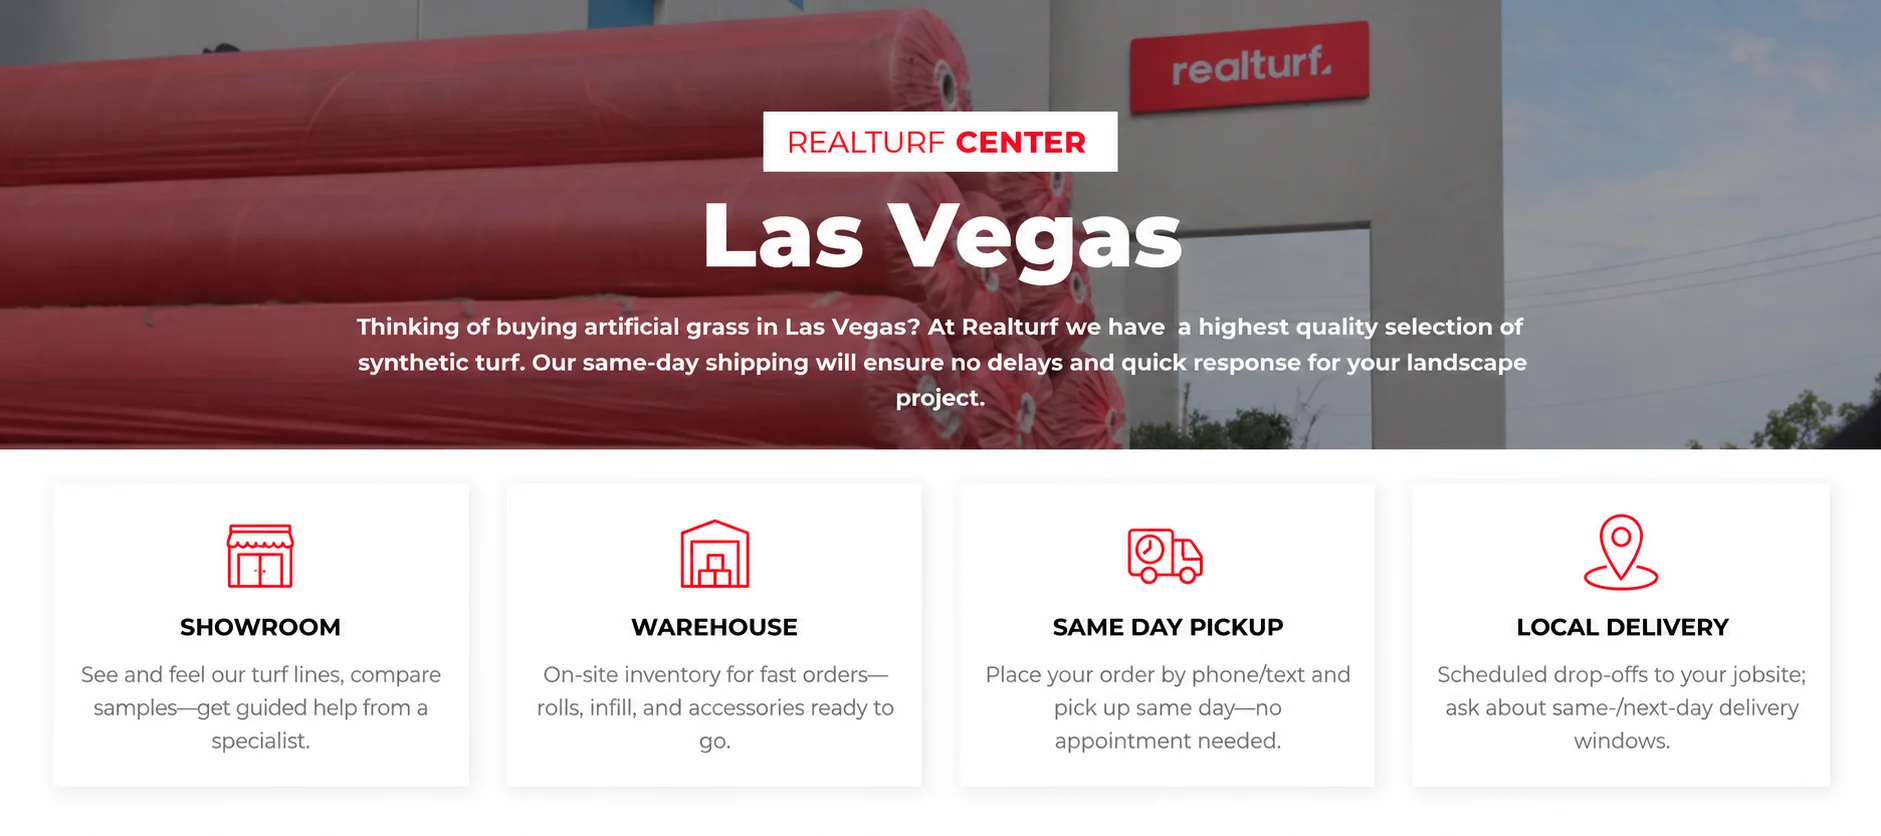
- A clearly defined local center
- Warehouse, showroom or pickup signals
- A specific product
- Structured specifications
- Manufacturer information
Weakened for
- National supplier queries
- Commercial procurement queries
- Feature-based searches
- Product-selection searches
- Comparison queries
- “Best for” recommendations
Visibility weakened when the query required Google to understand Realturf as a complete supplier and distribution system. The evidence suggested that Google could see many of the individual parts but did not consistently connect them into one decision-ready model.
08 Observation to recommendation
Worked diagnosis: the distribution network
The distribution network provided the clearest example of how the methodology moved from observation to action.
01 · Observation
Realturf appeared for several location-specific searches involving showrooms, warehouses and local pickup.
It was absent from many broader searches for national suppliers, wholesale distributors and contractor-focused fulfillment.
02 · Supporting evidence
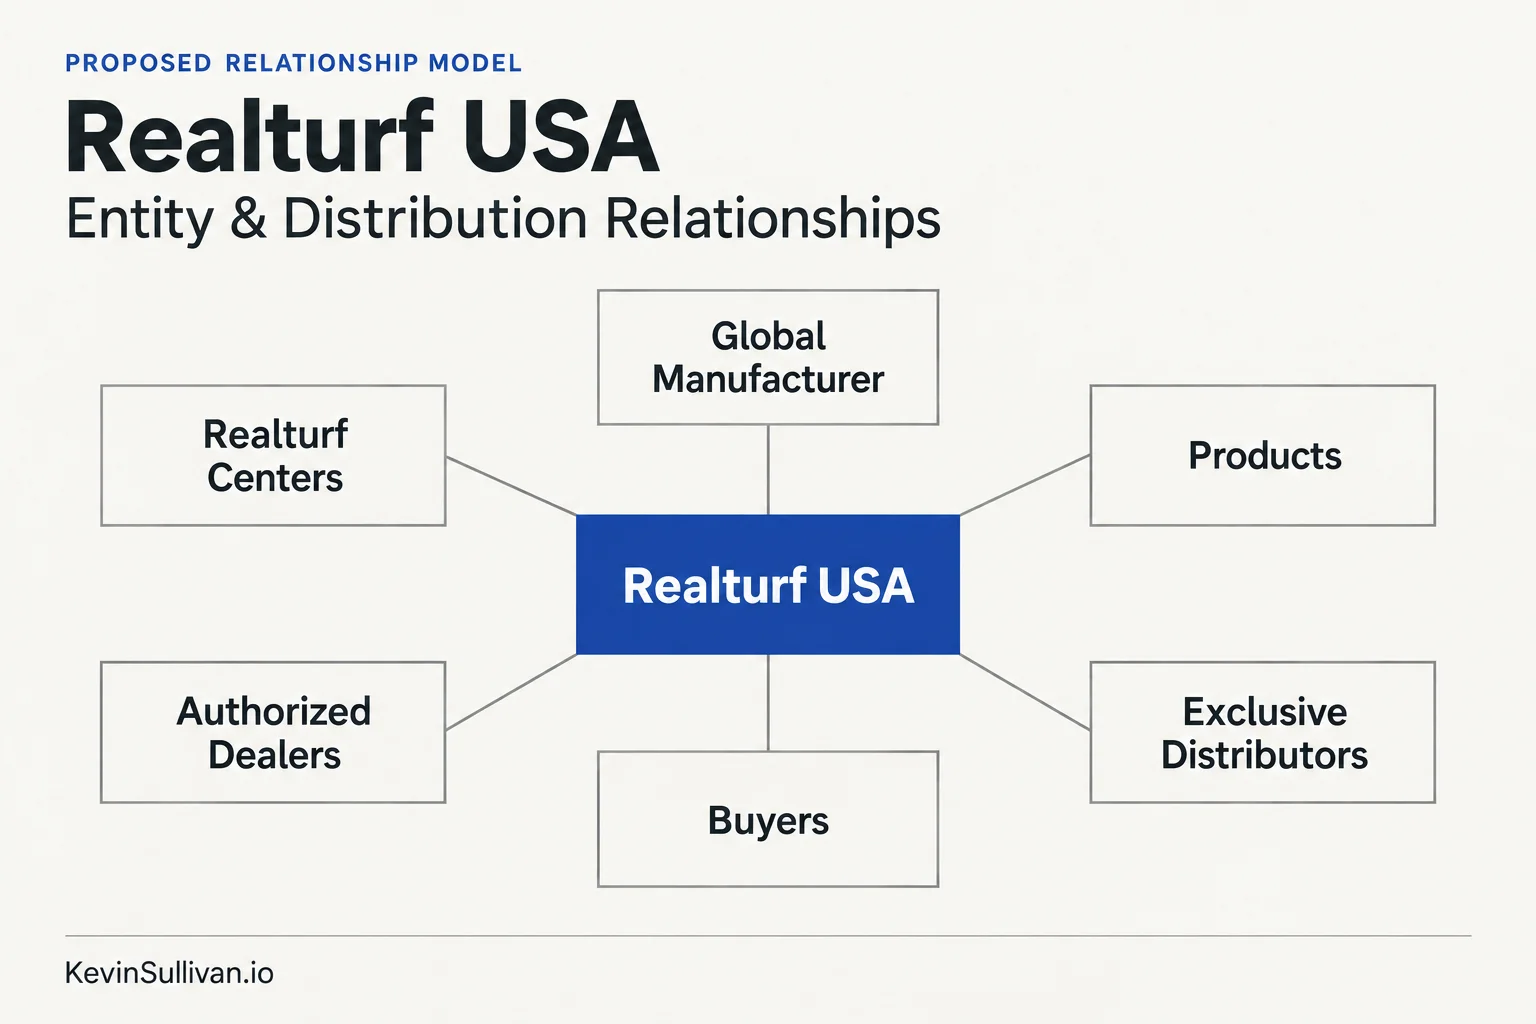
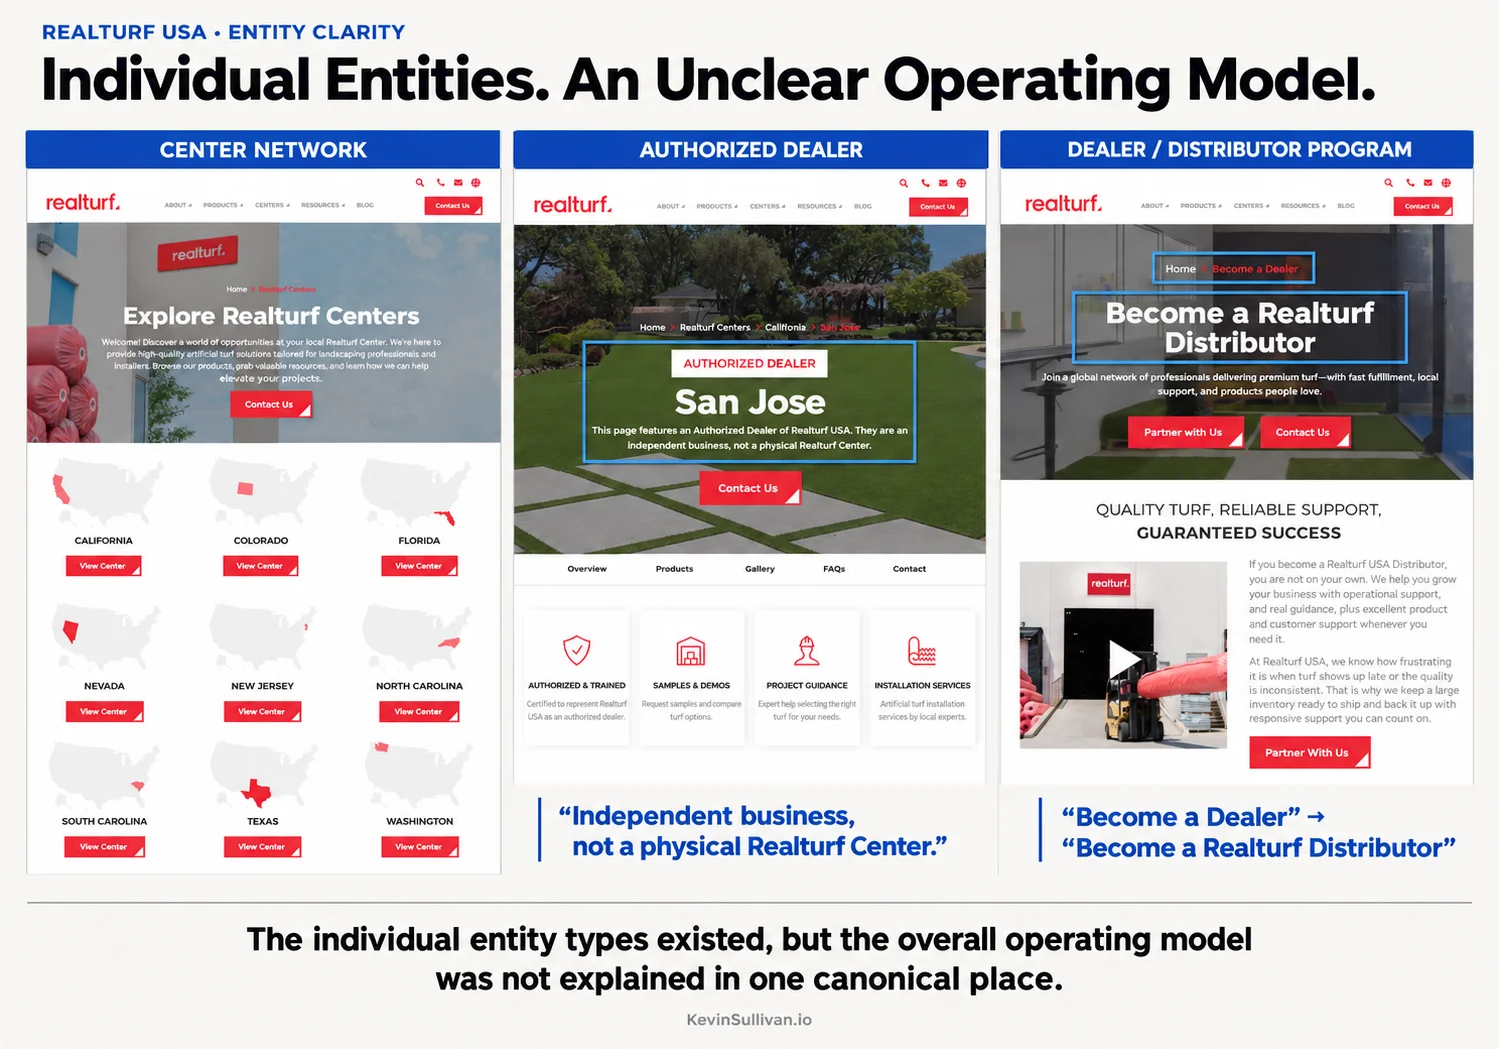
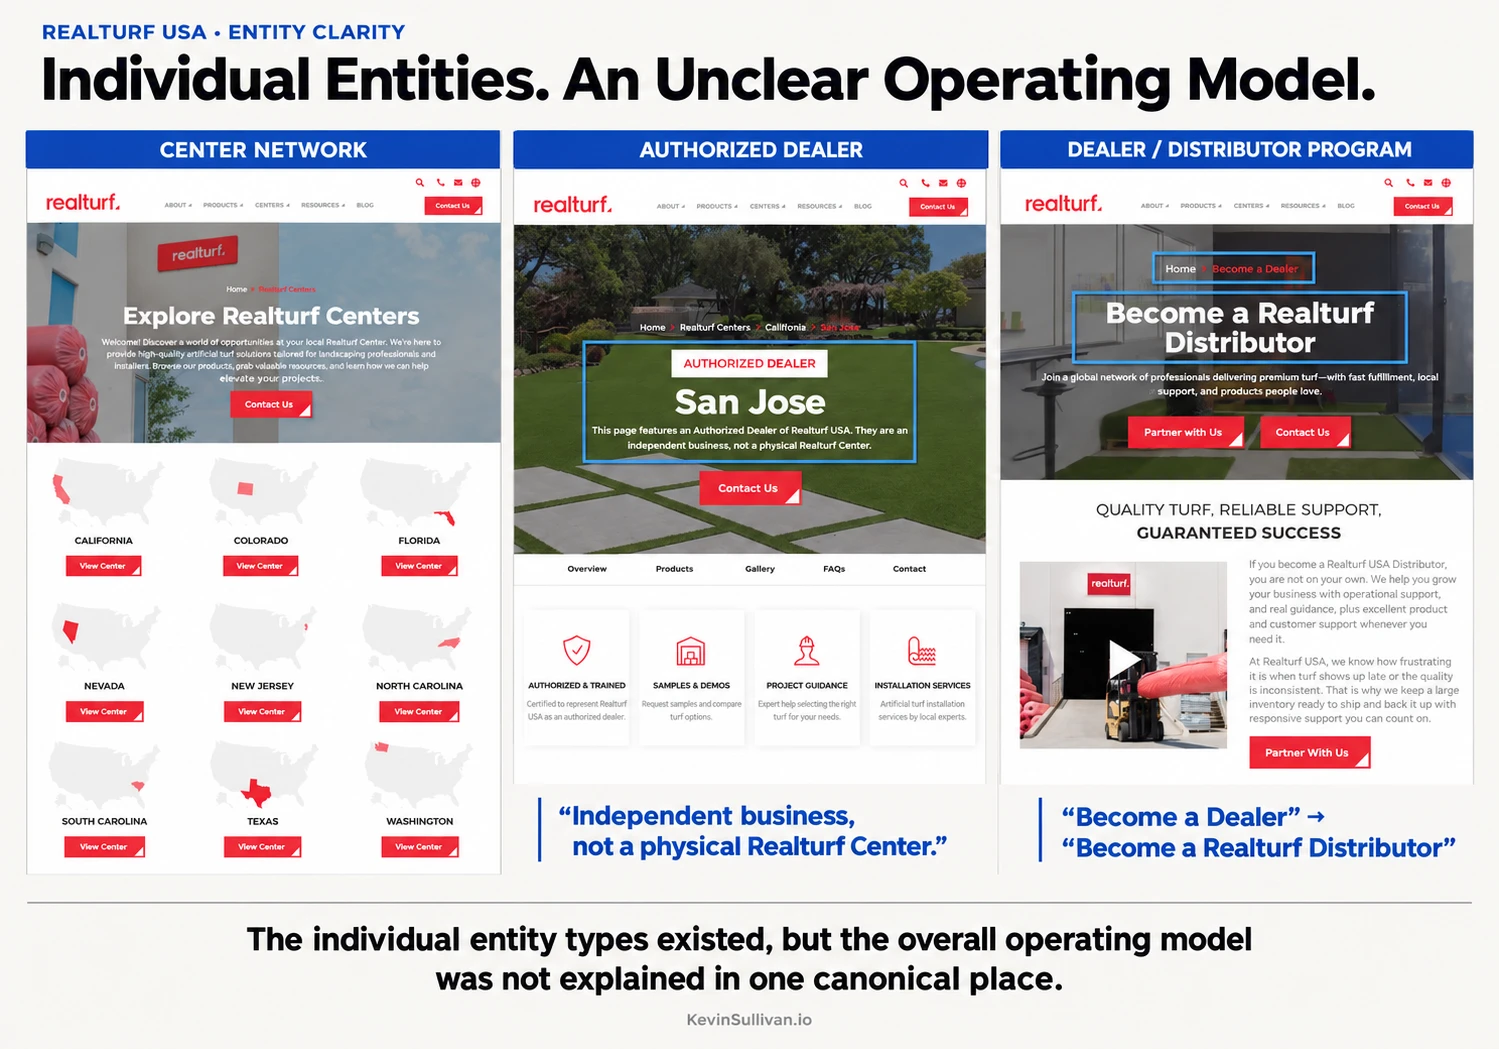
The website represented several related entity types—Realturf Centers, Authorized Dealers, Exclusive Distributors, Installers and partner locations—but the role of each was not always clearly differentiated.
Information about national shipping, local pickup, inventory, dealer relationships and fulfillment was distributed across multiple pages.
03 · Interpretation
Google appeared able to recognize individual locations. It had less evidence for interpreting the locations and partners as parts of one national distribution system.
Competitors with clearer supplier positioning, network explanations or fulfillment language were more likely to appear in broader sourcing contexts.
04 · Diagnosis
This was not simply a content-volume problem. It was an identity, architecture and relationship problem. The site needed a clearer representation of:
- What Realturf USA was
- How it related to the global manufacturer
- Who it served
- How its network was organized
- How products were distributed
- How customers could purchase or collect products
05 · Recommendation
The first major recommendation was a canonical Distribution Network Hub—a single source of truth for the operating model, defining the relationships among Realturf USA, its centers, dealers, distributors and fulfillment options.
Supporting pages would then reinforce that model through consistent terminology, internal links and structured data.
06 · Retesting plan
After implementation, the original supplier and distribution query groups would be tested again, examining inclusion, prominence, entity classification, competitors present, sources cited and consistency across related searches.
The recommendations were not implemented, so this retesting did not occur.
09 Recommendation · not implemented
From diagnosis to a 90-day roadmap
The findings were translated into a sequenced four-phase implementation roadmap. The sequence mattered because later recommendations depended on the earlier relationships being clearly defined.
Phase 1 · Weeks 1–2
Identity and eligibility
Define the operating model and resolve structural ambiguity.
- Create the Distribution Network Hub
- Define each network entity type
- Reinforce the business model across the site
- Resolve duplicate or incomplete content
- Remove credibility and relationship breaks
Phase 2 · Days 15–42
Decision-system layer
Help users and search systems understand how artificial-turf decisions are made.
- Build a structured Knowledge Hub
- Define system components
- Create industry-language feature pages
- Connect branded technologies to recognized feature categories
- Turn application pages into decision resources
Phase 3 · Days 43–70
Product proof and availability
Make products easier to evaluate and select.
- Standardize product pages
- Resolve product and variant inconsistencies
- Connect products to features and applications
- Clarify availability
- Create a consistent “where to buy” layer
- Centralize specifications and submittal documents
Phase 4 · Days 71–90
Validation and external proof
Strengthen corroboration.
- Build proof and documentation hubs
- Align partner and dealer information
- Improve certification and technical-document access
- Earn relevant external references
- Replace unsupported claims with proof-first language
- Prepare the query set for retesting
10 Output
What the diagnostic produced
The work resulted in a complete research and implementation package:
- 150+ manually conducted Google AI Overview tests
- An 80-query curated diagnostic dataset
- A query-level screenshot archive
- An entity and competitor database
- A competitive evidence library
- A five-dimension scorecard
- Entity and relationship findings
- Information-architecture recommendations
- A prioritized 90-day roadmap
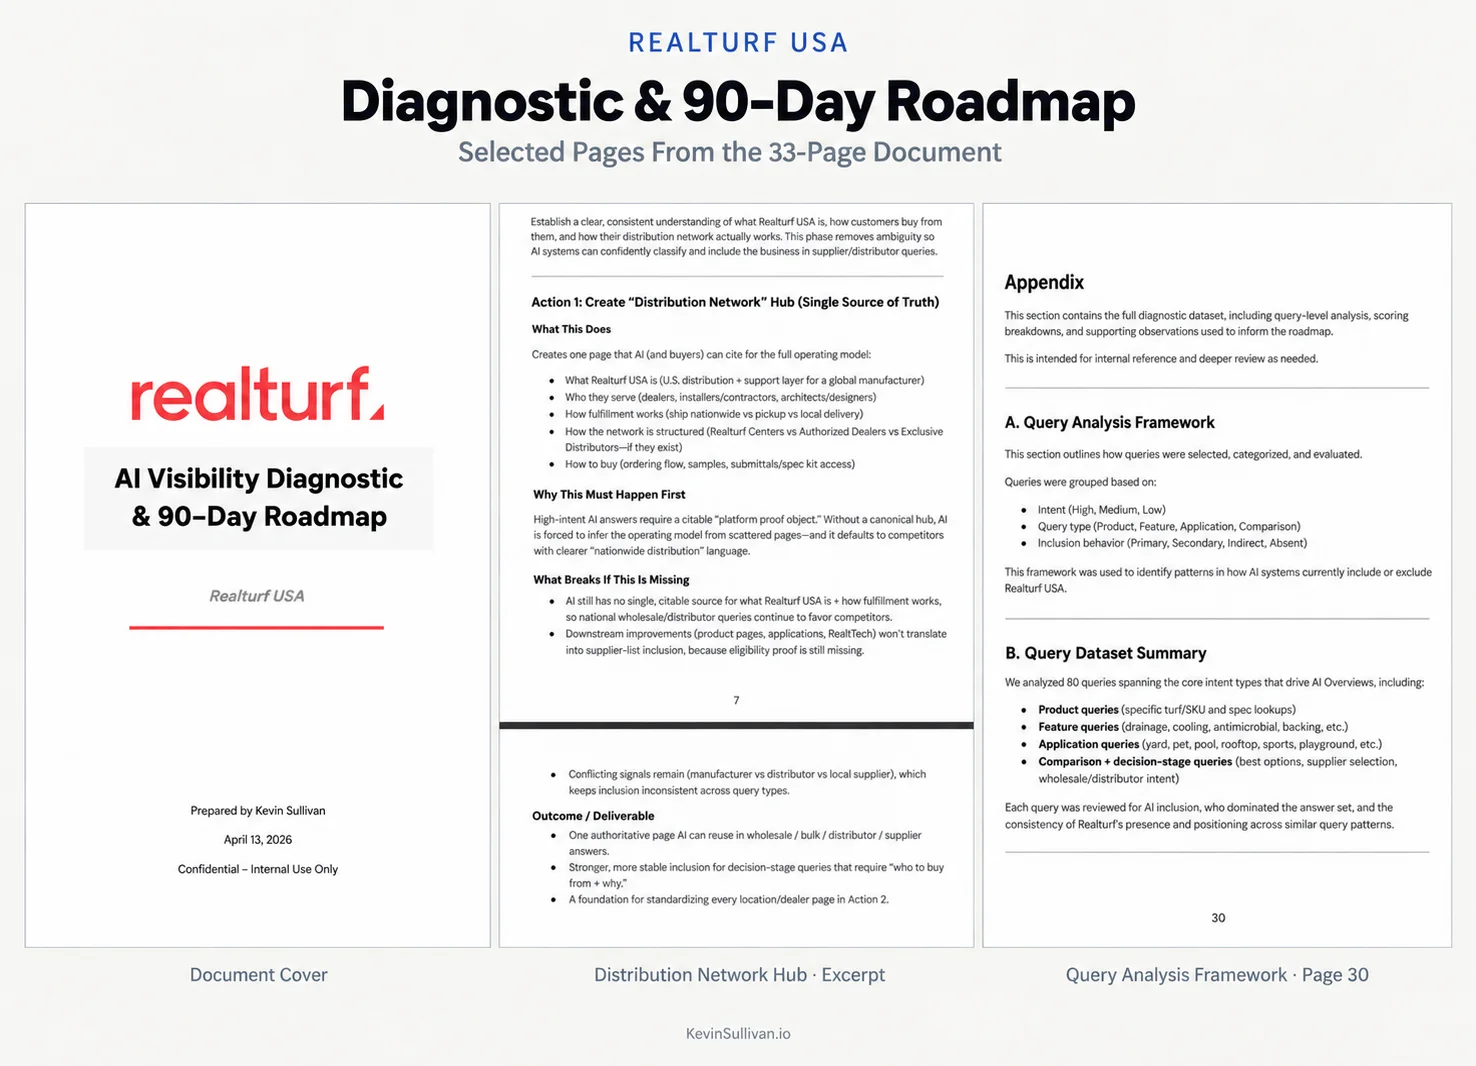
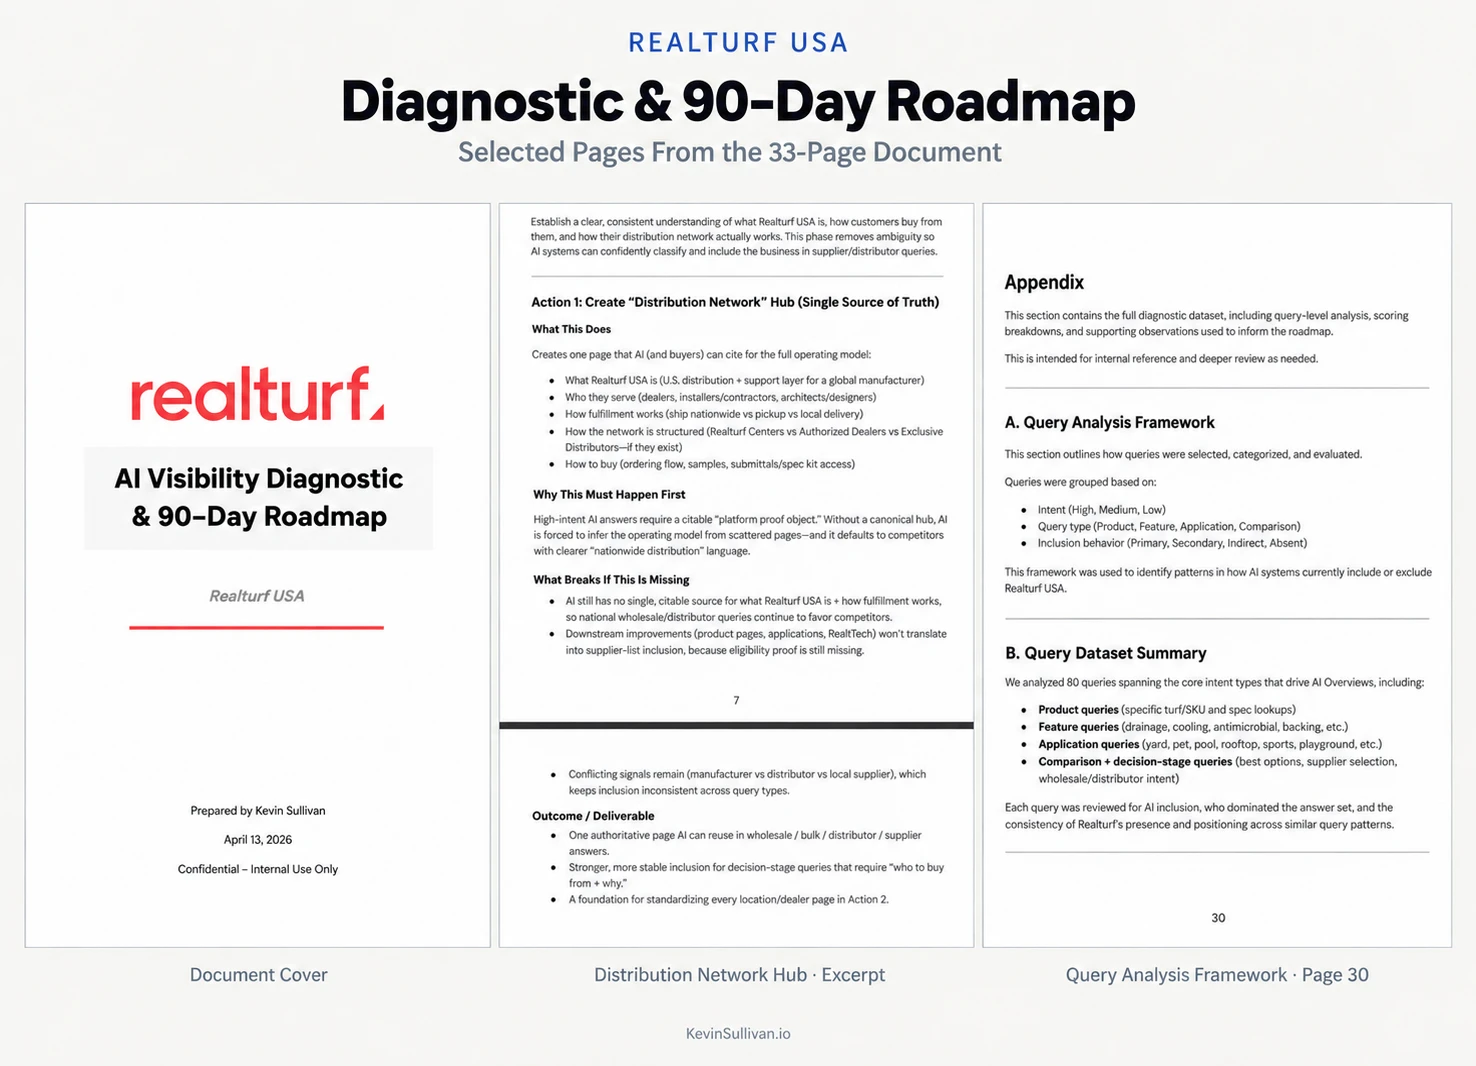
- A 33-page written diagnostic
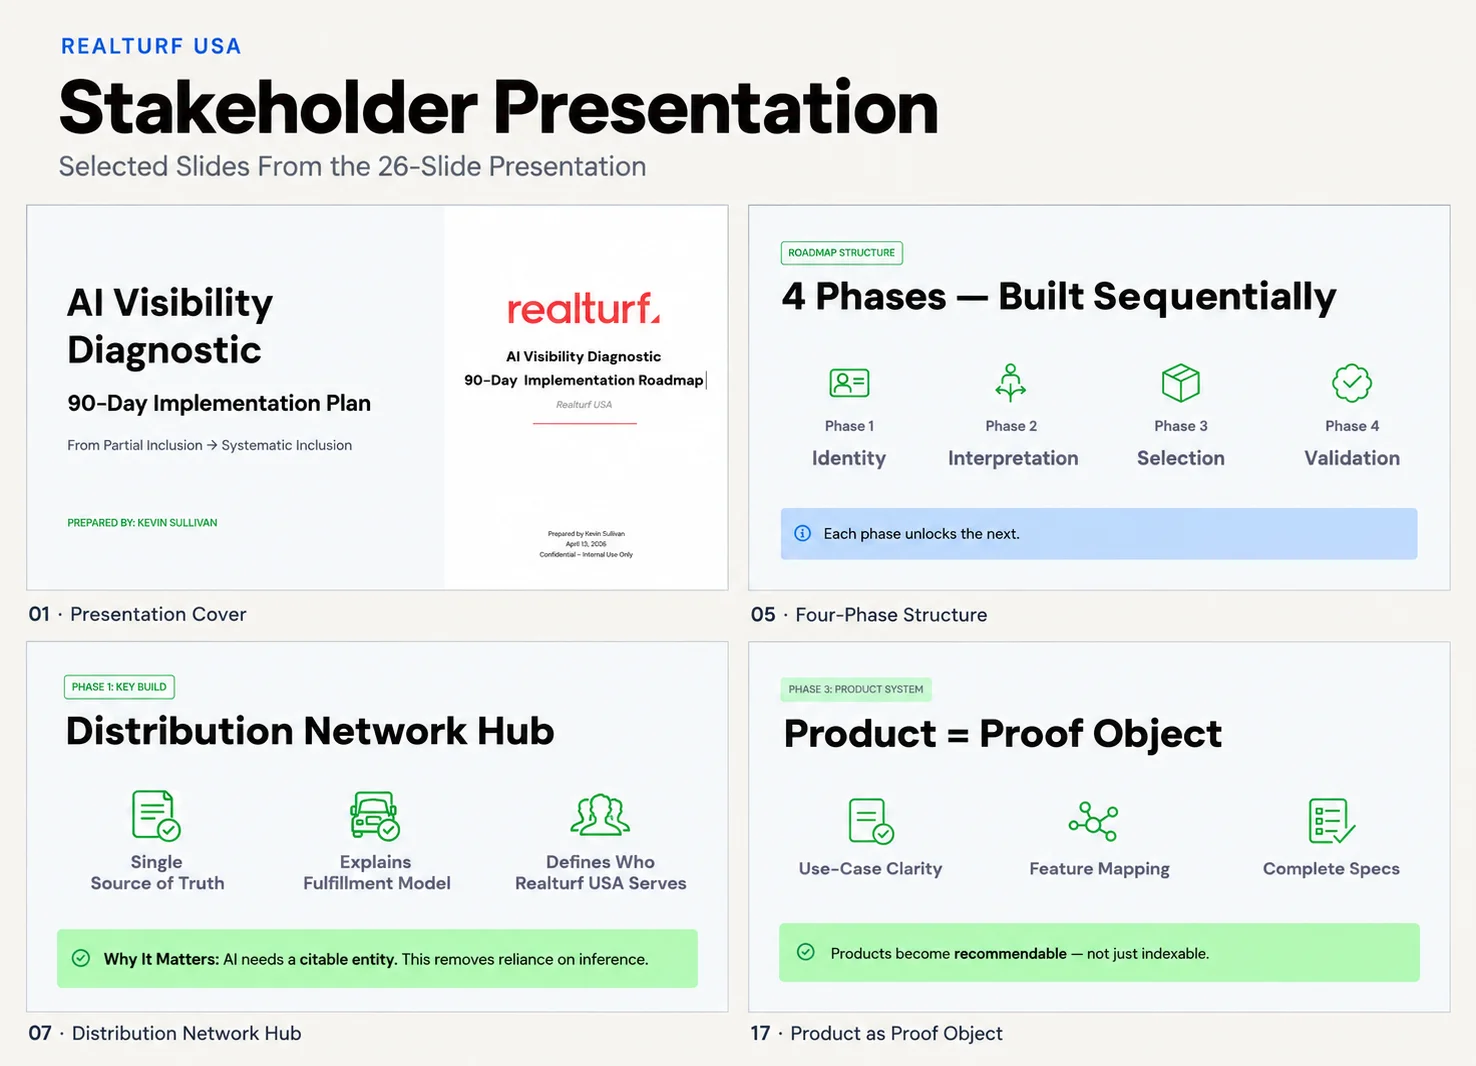
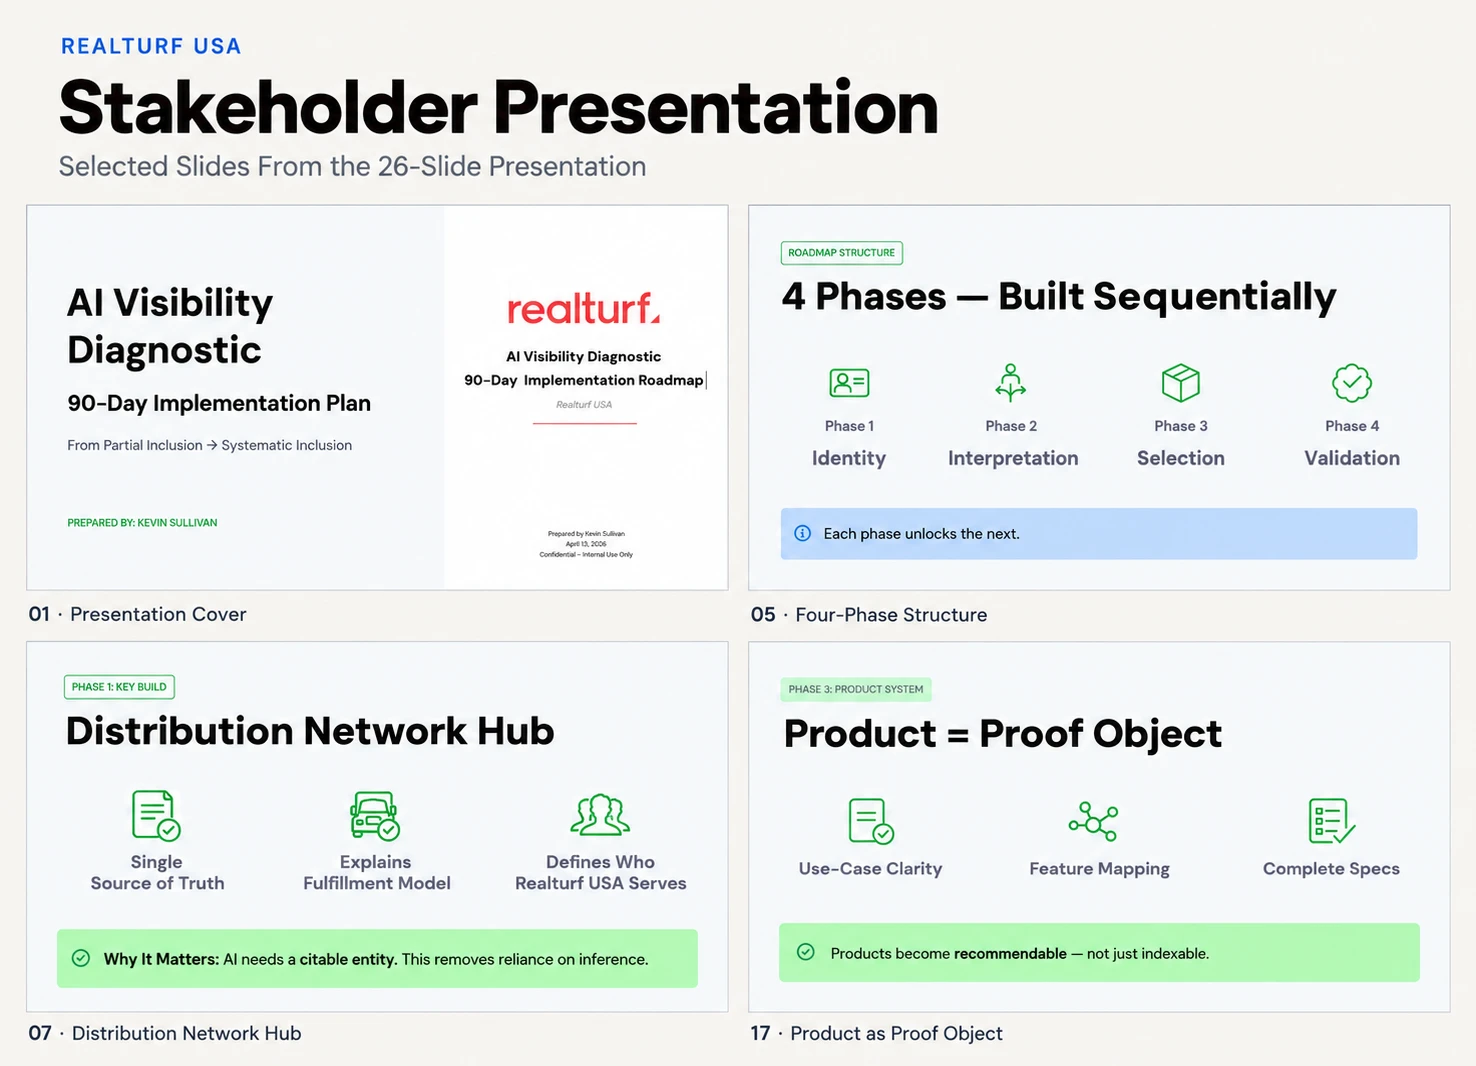
- A 26-slide stakeholder presentation
- A framework for post-implementation retesting
The written roadmap documented the reasoning behind each phase and recommendation. The presentation translated the findings into a format designed for stakeholder discussion and implementation planning.
11 Interpretation
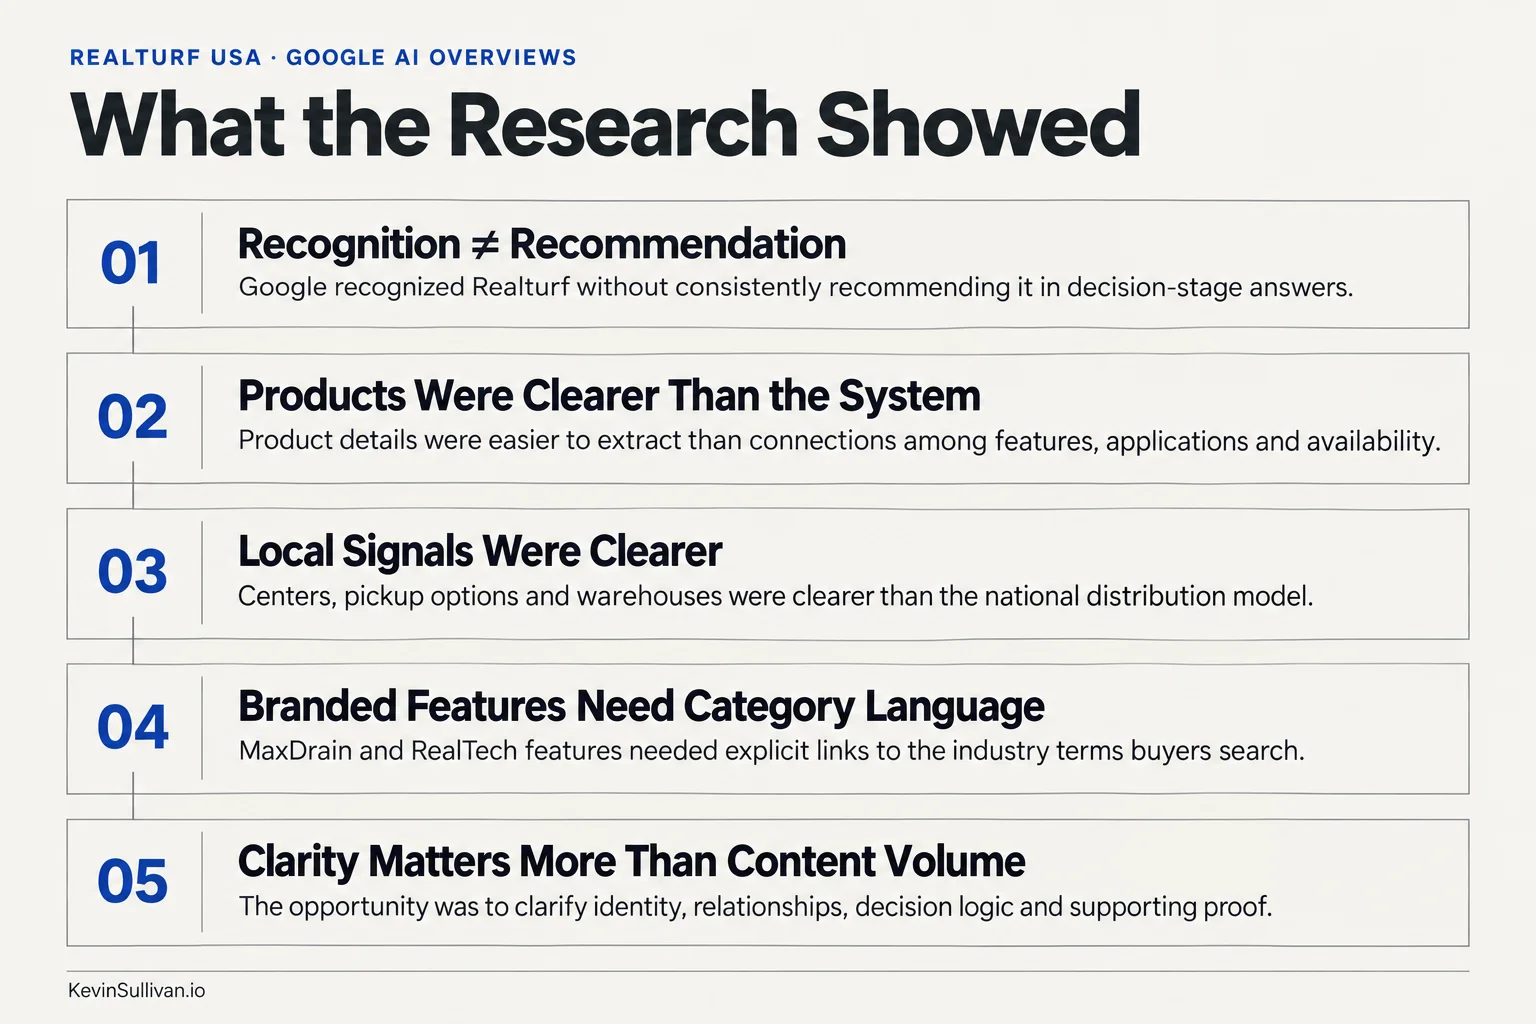
What the research showed
Recognition is not the same as recommendation
Google could recognize Realturf without consistently selecting it for decision-stage answers. Being understood at a basic level did not mean the company had enough connected evidence to become a frequent recommendation.
Product visibility can be stronger than system visibility
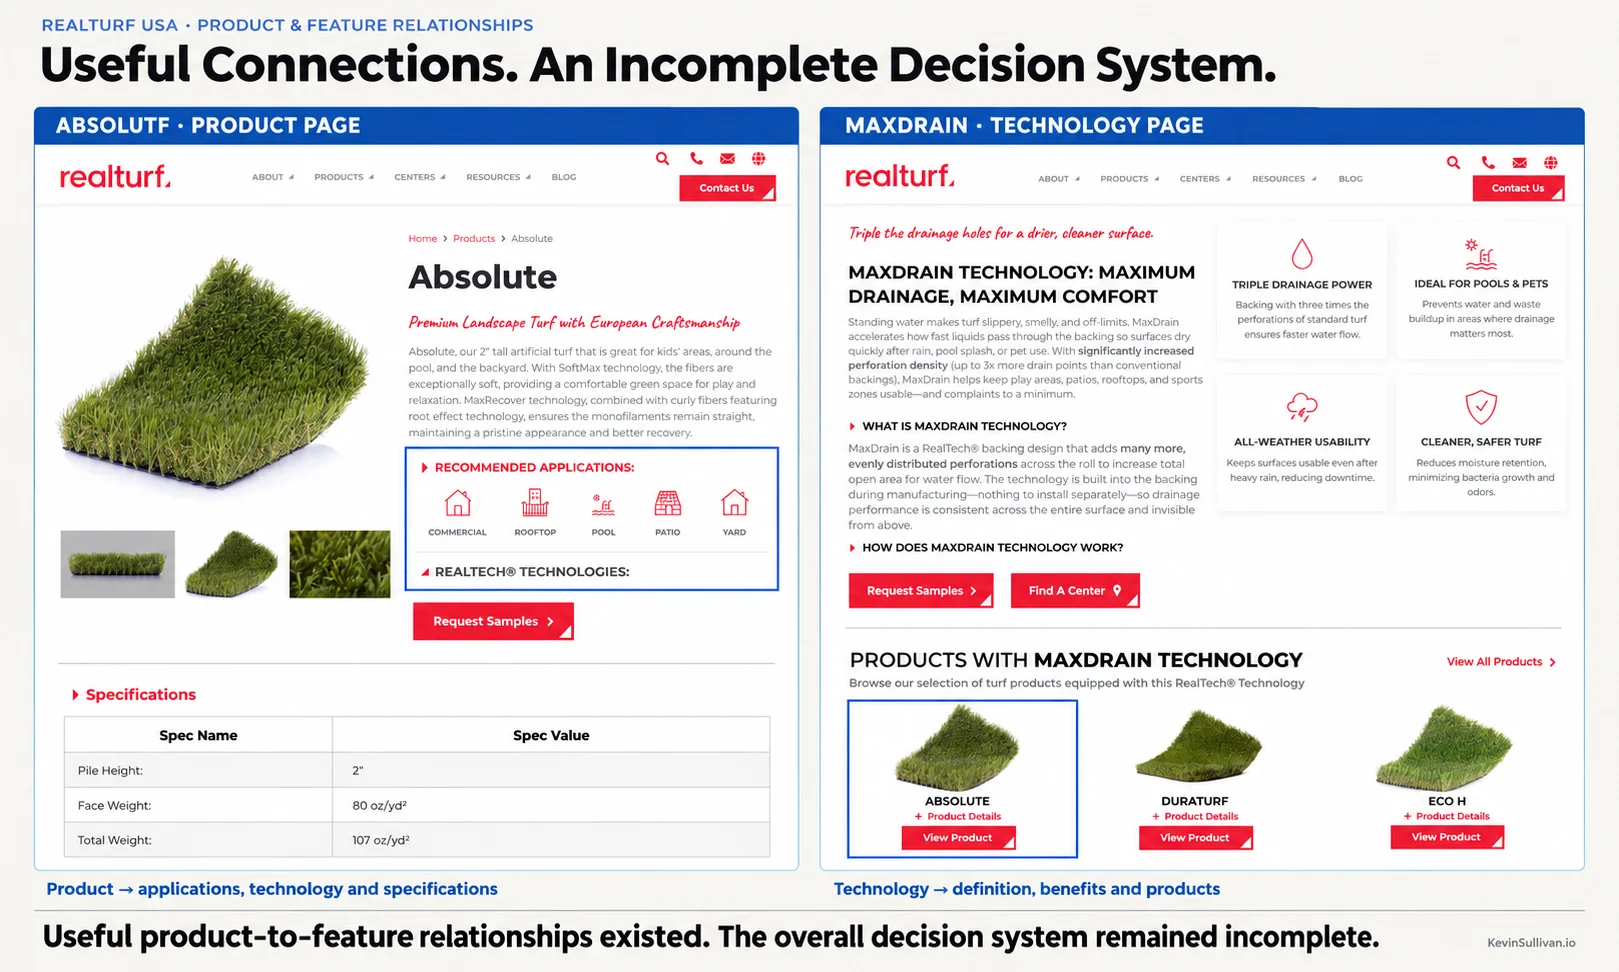
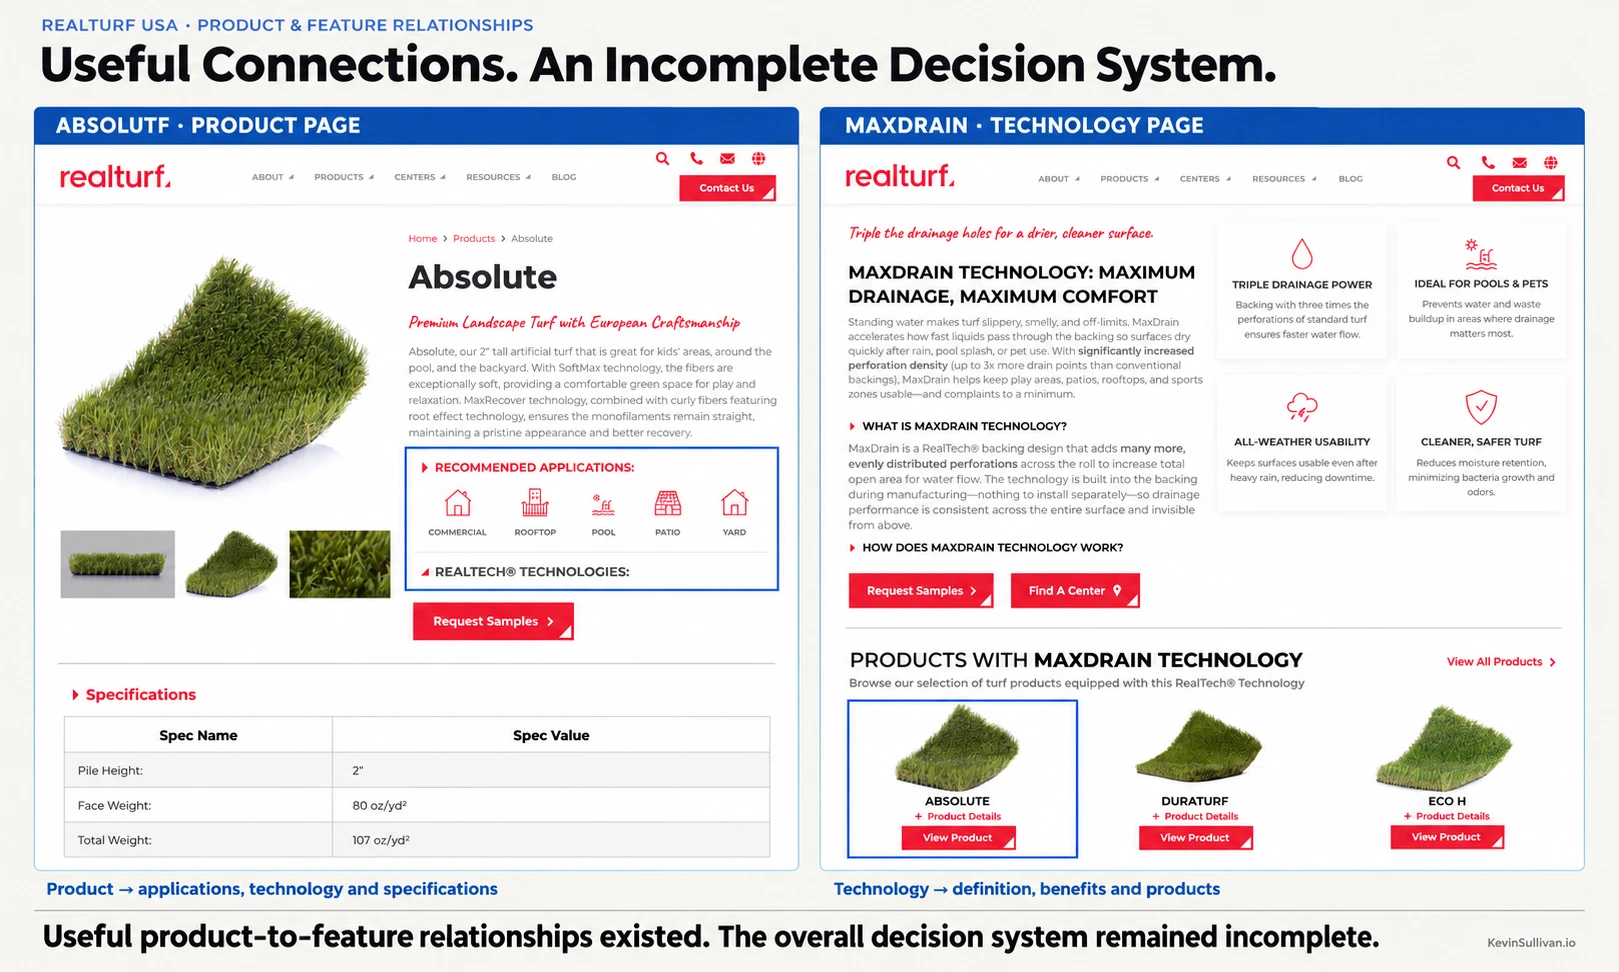
Specific product information and specifications were easier to extract than the full operating model. The site had product information, but the connections among products, features, applications and availability were less consistent.
Local clarity can outperform national positioning
Physical centers, pickup options and local warehouse signals created clear evidence for local queries. The broader national distribution model did not have the same clarity.
Branded features need category translation
Realturf had branded technologies such as MaxDrain and other RealTech features. AI systems also needed clear connections between those branded terms and the industry-language concepts people used in searches.
Content depth is not the same as information clarity
The central opportunity was not to publish more content indiscriminately. It was to make the company’s identity, relationships, decision logic and supporting proof more explicit.
12 Method
How the methodology works
The repeatable workflow has four stages.
01 · Completed
Observe
Document what appears, where it appears and in what context. Record inclusion, prominence, competitors, cited sources and interpreted entity types.
02 · Completed
Interpret
Compare the AI results with the company’s website, architecture, relationships and external signals. Separate direct evidence from working hypotheses.
03 · Completed
Prioritize
Translate recurring patterns into entity, architecture, content and validation recommendations. Sequence the work by dependency, not as an unstructured task list.
04 · Planned
Test again
Repeat the original query groups after implementation. Document what changed, what did not change and what remains uncertain.
For the Realturf project, the first three stages were completed. The fourth stage was planned but not performed because the engagement concluded before implementation.
13 Method
AI-assisted, human-led
The methodology was designed as a human-in-the-loop process.
AI can assist with
- Organizing evidence
- Summarizing responses
- Clustering recurring patterns
- Drafting structured notes
- Generating candidate hypotheses
Human judgment remains responsible for
- Evaluating source quality
- Identifying entity ambiguity
- Interpreting architecture
- Testing competing explanations
- Prioritizing recommendations
- Verifying final deliverables
- Documenting uncertainty
A useful diagnostic cannot be produced by counting mentions alone. The interpretation and prioritization stages require SEO, entity and information-architecture judgment.
14 Design stage · not built
What evolved next
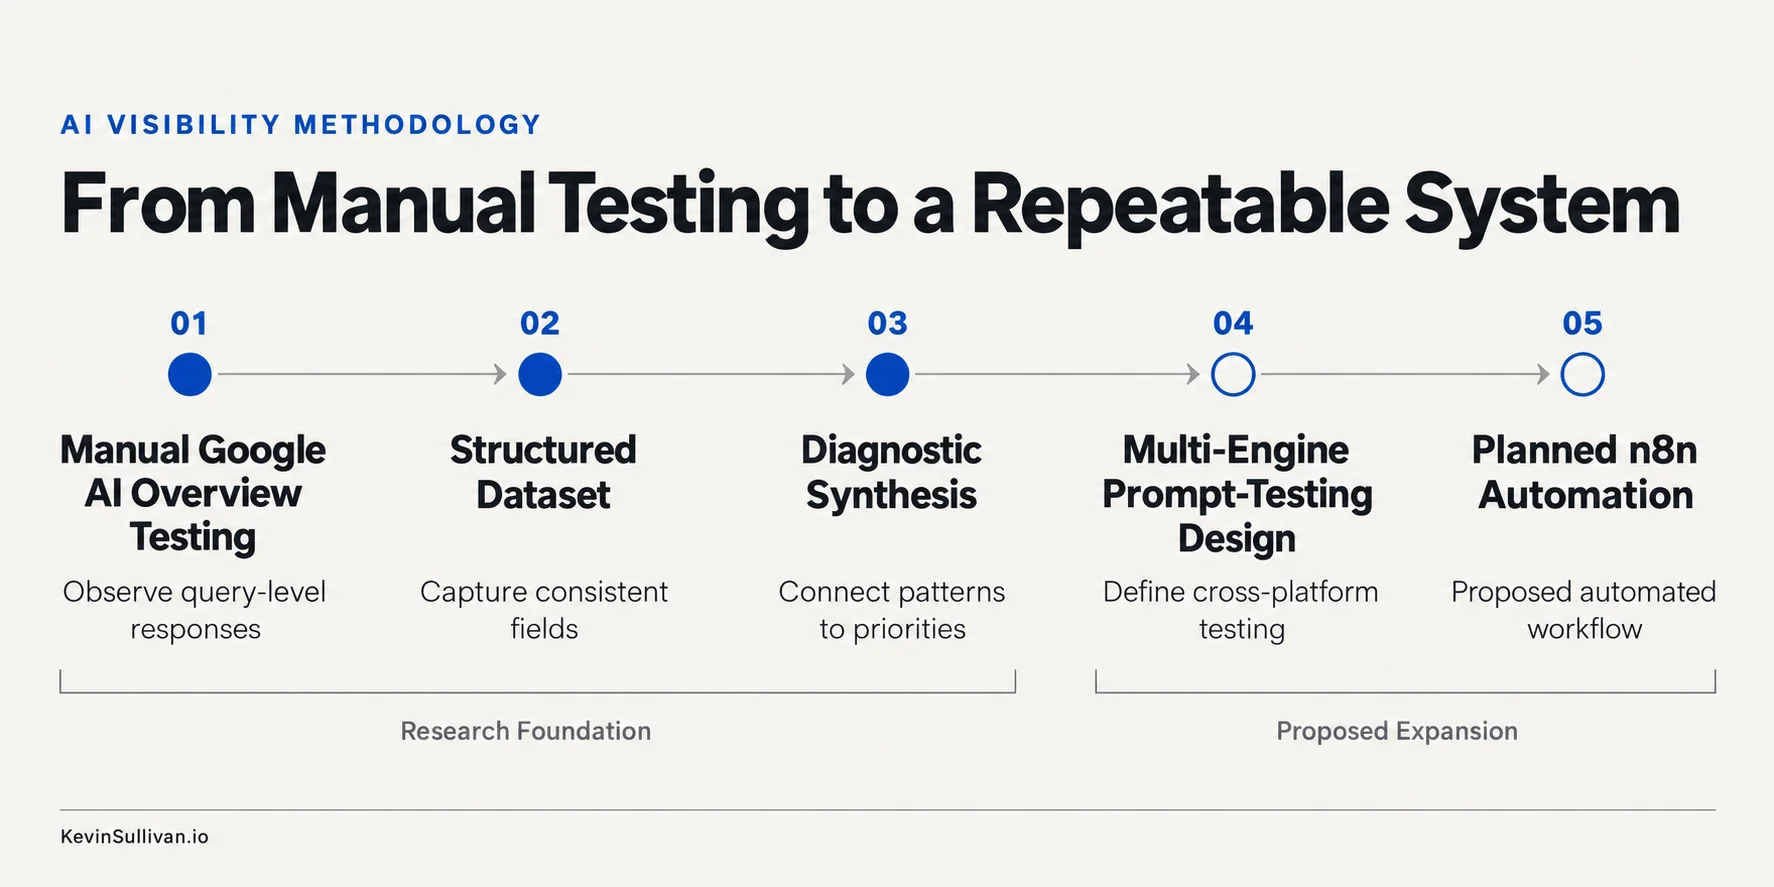
The original Realturf diagnostic relied heavily on manual research and evidence collection. After completing it, I began converting the process into a more reusable operating system, with connected databases for suppliers and entities, screenshot evidence, client diagnostics, diagnostic synthesis and prompt testing.
Diagnostic Synthesis layer
Standardizes
- Entity classifications
- Competitor sets
- Diagnostic scope
- Scores
- Root causes
- Confidence
- Strongest patterns
- Weakest areas
- Recommended priorities
- Roadmap phases
- Evidence counts
- Testing batches
Prompt Testing layer
Extends the structure with
- AI engine assignment
- Workflow status
- Query type and intent
- Inclusion and prominence
- Selection drivers
- Gap types
- Root-cause tags
- Roadmap relationships
- Screenshot evidence
- Pasted responses
- Batch identifiers
I also planned an n8n workflow to support testing across Google AI Overviews, ChatGPT, Claude, Gemini and Perplexity. The data model and workflow design were developed after the original Realturf diagnostic.
The complete multi-platform automation was not implemented, so I treat it as an operating-system design rather than a finished automated product.
15 Limitations
Evidence status and limitations
This methodology has been applied in a real supplier and partner-network environment. The Realturf research covered Google AI Overviews only.
Testing was conducted manually in Chrome Incognito Mode. The results reflect a point-in-time sample and could be affected by geography, interface changes, model updates and Google experiments.
The 56/100 score was a custom diagnostic baseline. It was designed for prioritization, not as an industry-standard benchmark.
The diagnostic and roadmap were delivered, but the engagement concluded before implementation. The recommendations were not implemented, the query set was not retested and no improvement in AI visibility is claimed.
The project demonstrates a research, diagnosis and implementation-planning process. It does not provide causal proof that any individual recommendation guarantees inclusion in an AI-generated answer.
16
What this work demonstrates
This project shows how I approach an emerging search problem when established measurement standards are still developing.
- I start with observable evidence.
- I separate findings from hypotheses.
- I connect visibility to entity interpretation, information architecture, relationships and validation.
- I turn the diagnosis into sequenced work that technical, content and leadership teams can evaluate and implement.
- Then I look for ways to convert the one-time process into a reusable system.
That combination of SEO depth, AI-search experimentation and systems thinking is the value of the methodology.